By David Spratt
The scientific imperatives are overwhelming. The planet has just experienced its first month with warming more than 1.5C above the pre-industrial temperature zone, and the hottest winter on record in Australia.
Extraordinary events with the North Atlantic sea-surface temperatures and with Antarctic sea-ice are way outside scientific projections and expectations. The Canadian bushfires are blowing away all records. And on it goes, as Joelle Gergis describes in her recent essay for The Monthly.
Policymakers tell us we are on the path to decarbonising the energy sector and the economy, but the reality is different from those carefully-manicured expectations. Take one example. Governments, including that of the USA, will make all sorts of pledges and noises about being committed to net zero emissions by 2050. Or more accurately, as Prof.Kevin Anderson puts it, “not zero”.
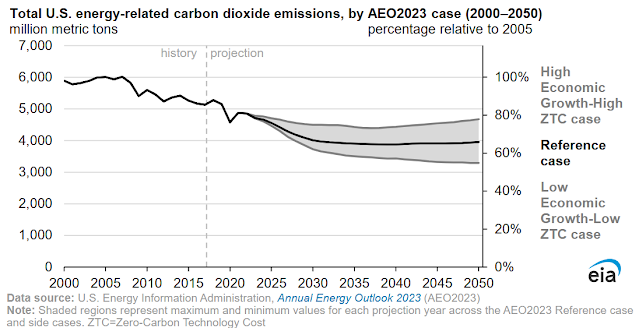
Then have a look at this chart from the US Energy Information Administration on projected energy-related carbon dioxide emissions to 2050 for the USA. The central, or reference case, is for emissions to have fallen just 20% over the next 30 years! No wonder, when the US is pumping oil faster than ever.
 |
| Click on chart for higher-resolution image |
And then there is China, where a continuing coal spree means the world’s biggest carbon emitter is approving the equivalent of two new coal plants a week.
In Australia, the positive impact from the deployment of renewable energy is largely being offset by rising emission from new and expanding coal and gas projects. If land use changes are excluded and actual emissions are counted, Australia’s emissions have declined just 1.6% in total since 2005.
It is part of a wilder picture. Shane White, who researches energy data and runs worldenergydata.org has recently done updates on energy and decarbonisation trends. Take the global carbon intensity of energy supply (calculated by dividing annual carbon dioxide emissions from energy by annual total energy supply), as illustrated here, and calculated using Energy Institute Statistical Review of World Energy 2023:
 |
| Click on chart for higher-resolution image |
It shows that the world energy system decarbonised from 1965 to 2000, but then re-carbonised from 2001 to 2011. After that carbon intensity didn’t reduce to the level of 2001 until 2016. Over the last 50 years, the average decline has been 0.34% a year relative to the 1972 figure. Will it decrease? At an increasing rate? It should, but that will depend on rapidly bending down the use of fossil fuels.
Here the data is confronting. As illustrated, between 1990 and 2020 the share of fossil fuels in annual gross world energy consumption (i.e. final energy) by share fell from 82.2% to 79.6%, or less that 3% in 30 years. The data used is from the IEA.
 |
| Click on chart for higher-resolution image |
Finally, there is the question of the trends in fossil fuel production. Here the data is from the Energy Institute Statistical Review of World Energy 2023 and compiled by Shane at www.worldenergydata.org/world-fossil-fuel-production-and-primary-energy.
 |
| Click on chart for higher-resolution image |
And Australia’s role? “Australia has become the largest exporter of metallurgical coal and LNG, and the 2nd largest exporter of thermal coal. Expansion of these exports on a prodigious scale is a priority for both major Australian political parties,” says White.
